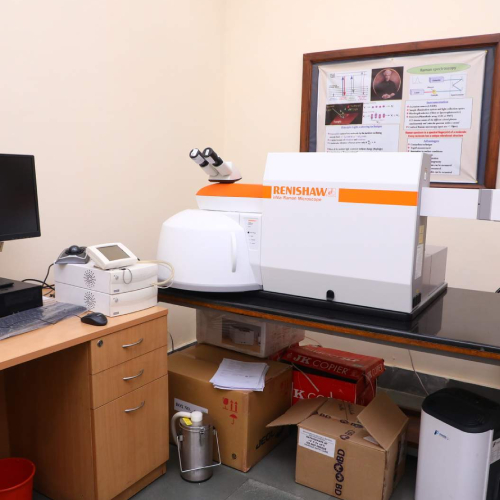
Laser Raman Spectrometer
Requisition forms
Please download the requisition form, fill it in, sign it, and upload the filled copy with your booking. This requisition form is provided by the USIC office for this instrument.
Process: submit booking → in-charge approval → pay on the DU fee portal → upload Order ID + receipt → measurement confirmed. See the payment flowchart and user guidelines.
About this instrument
Renishaw Raman can be used with two types of lasers- 532nm and 660nm with different magnification lenses. • Diode laser 532nm 50 mW • Renishaw Diode laser, solid state Near IR. Capability: • High resolution – better than 1 cm -1, • Long working distance objectives for temperature variation. • Raman spectrometer can be used for getting characteristic vibrational frequencies of atoms which provides finger print by which chemical composition and structure of material can be identified, crystallographic orientation of the sample, identification of particles in micrometer dimension variation in composition can be mapped to provide images based on the distribution of molecular composition. • Focusing can be done with the use of coarse focus, fine focus and super fine focus.